 Japan Quake Map
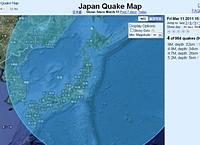
3月11日午前0時以降の地震の発生状況を、地図上に時系列でグラフィカルに表示するページです。震源の深さと規模(マグニチュード)も表示し、規模が大きい地震は地図上で大きな円で描かれます。3月11日は、あの本震の前にマグニチュード5前後の地震が3回起こっていたことがわかります。データは、地震発生日別に確認することも出来ます。
http://www.japanquakemap.com/
以下は上記ページの案内文からの引用です(英文)。データは米政府傘下の研究機関であるアメリカ地質調査所(USGS)のものを使用しているようです。
.....On the 11th of March 2011, the world's media reported a massive earthquake off the East coast of Japan. It turned out to hit magnitude 9 on the Richter scale, and caused a devastating tsunami; the region's nuclear power facilities have been experiencing major difficulties since the earthquake and tsunami triggered a series of events leading to massive overheating.
The Japan Quake Map on this website pesents a time-lapse visualisation of the Sendai earthquake and its aftershocks, primarily to help those outside the affected area understand what the people of Japan are experiencing. It plots earthquake data from USGS on a map using the Google Maps API, with the size of the circle denoting the magnitude (the higher the magnitude, the larger the circle) and the colour showing the focal depth (see the legend below the map). .....
また、このページの作者の方はニュージーランド地震で同様の地図ページを開発されているようです。
Christchurch Quake Map
http://www.christchurchquakemap.co.nz/

